Tranztec's existing integration product worked, but it was slow to use. When a customer wanted to connect a new system, an implementer would hand-code the integration, mapping fields between schemas, writing transformation logic, handling edge cases. A typical integration took over a week.
Leadership's brief was direct: bring implementation time down. Way down. The bet was that AI-assisted natural-language instructions could collapse most of the hand-coding. The implementer would describe what they wanted, the AI would do the work, and the implementer would review, adjust, and ship.
The AI mapper wasn't the only direction. The team sketched two others.
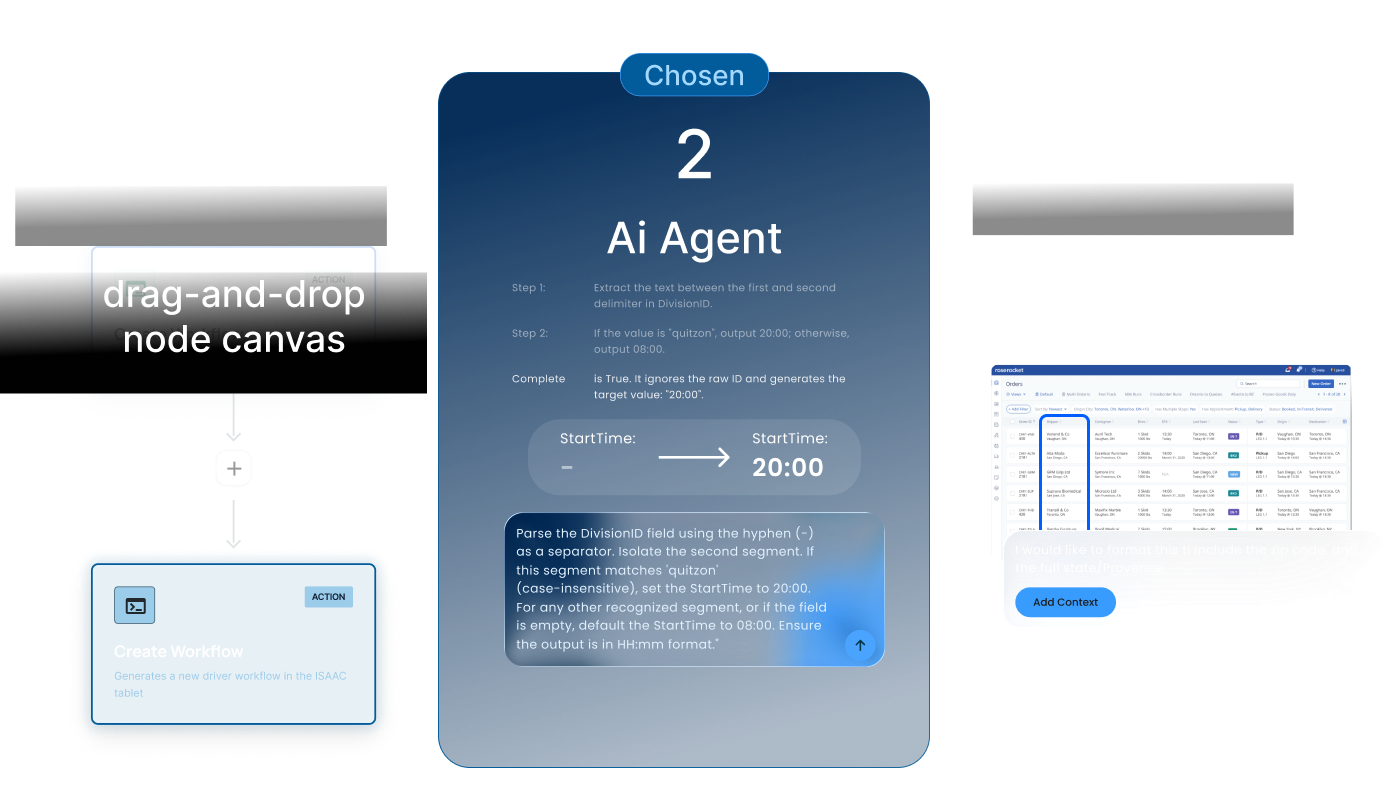
A drag-and-drop node canvas, Zapier-style. Visually familiar, but didn't collapse the work, a complex transformation might require thirty nodes, replacing code with a visual representation of code.
AI Markup. Mark up a visual representation of the destination system, point at where you want a change. Promising, but not workable: we'd need a visual representation for every customer TMS/ERP/WMS.
Chosen direction
The AI mapper prototyped fastest and was already getting positive reactions from internal testers within weeks. Given the time pressure, we committed.
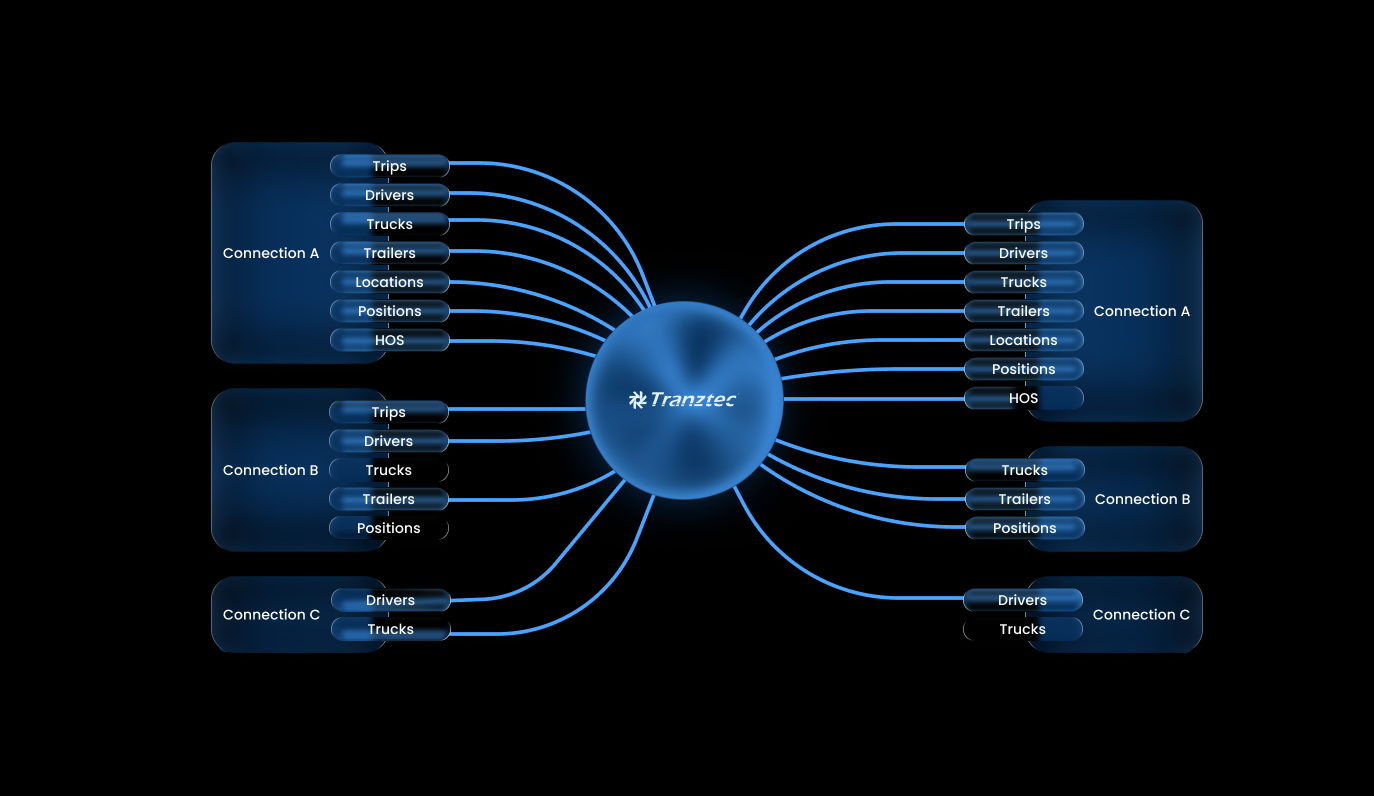
Each connection has three layers: data coming in from the external system, data living on the platform, and data going out. The AI mapper edits the transformation logic at the boundaries, per data type. Not every external system supports every direction. The platform mirrors what each connected system actually allows.
This is the centerpiece of the design, and the feature the whole product's value depends on.
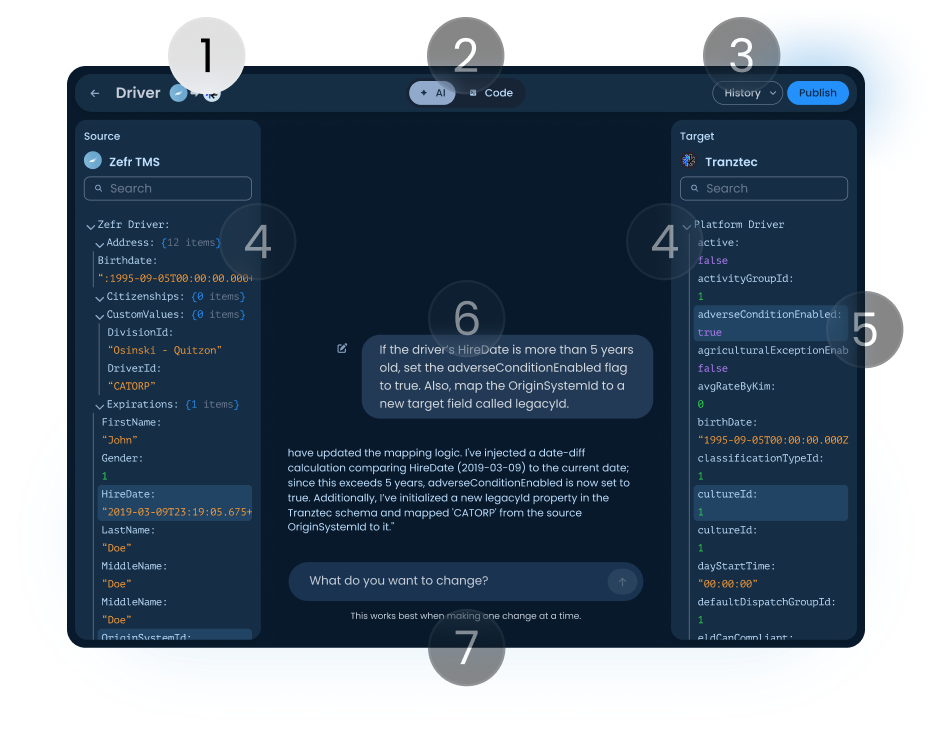
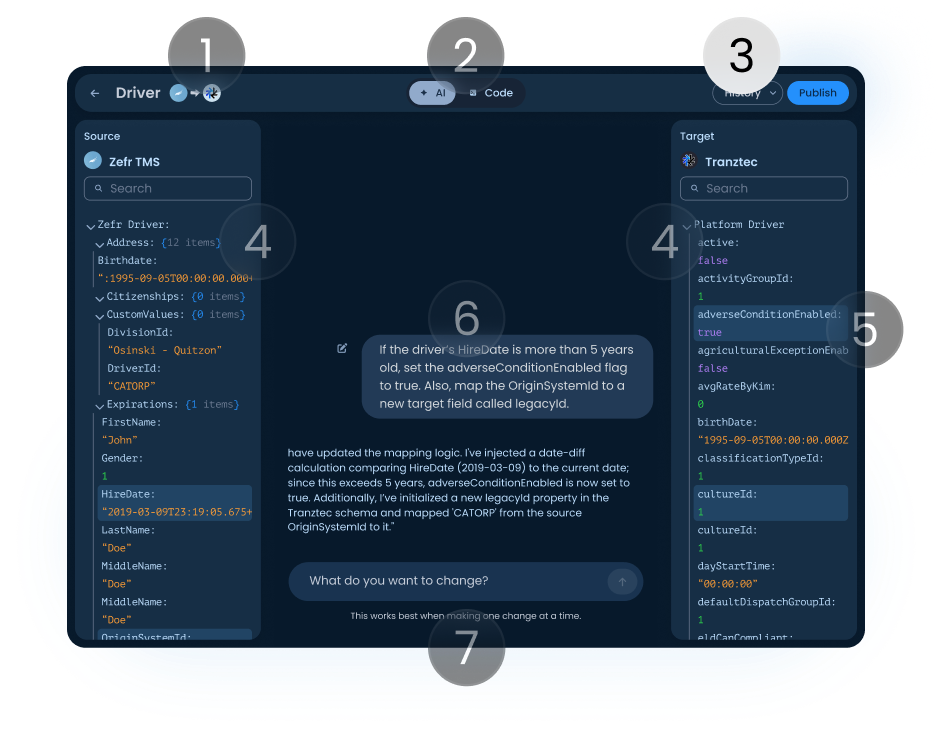
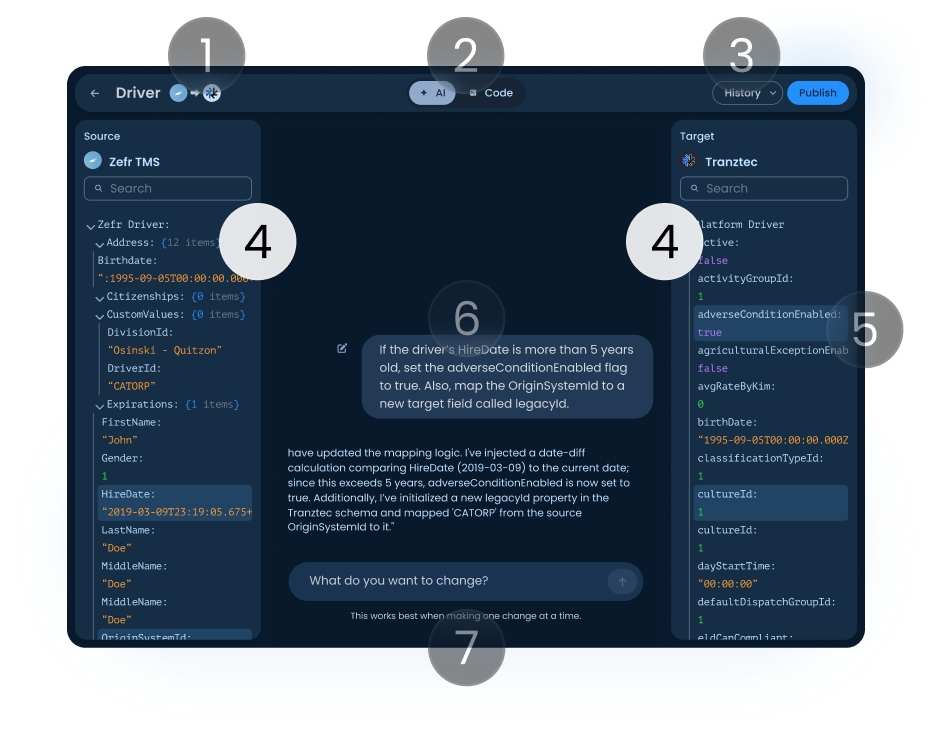
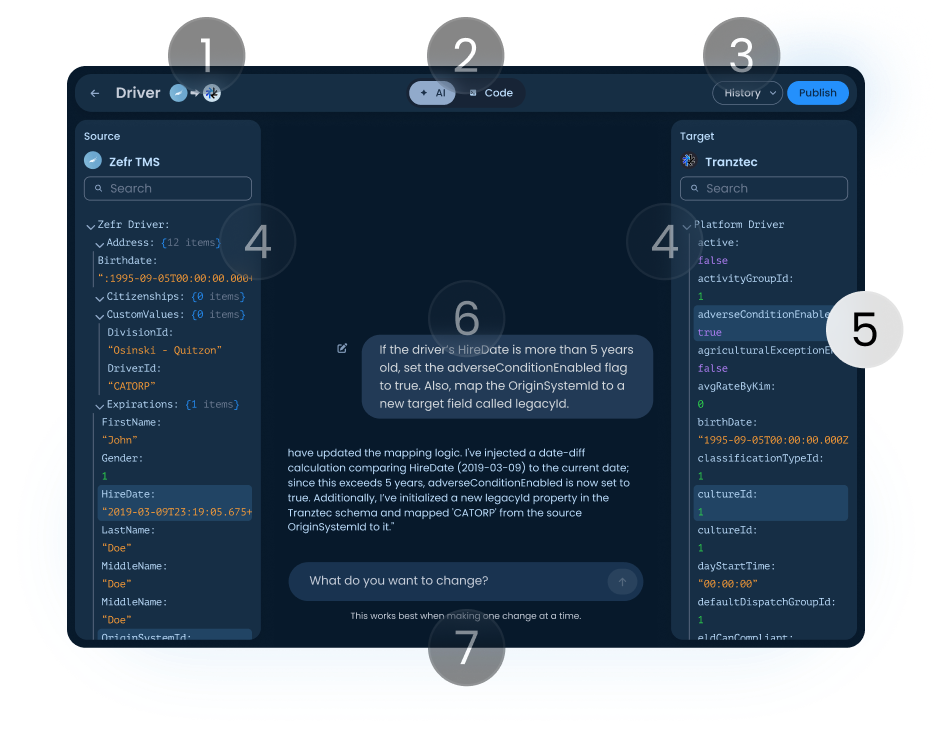
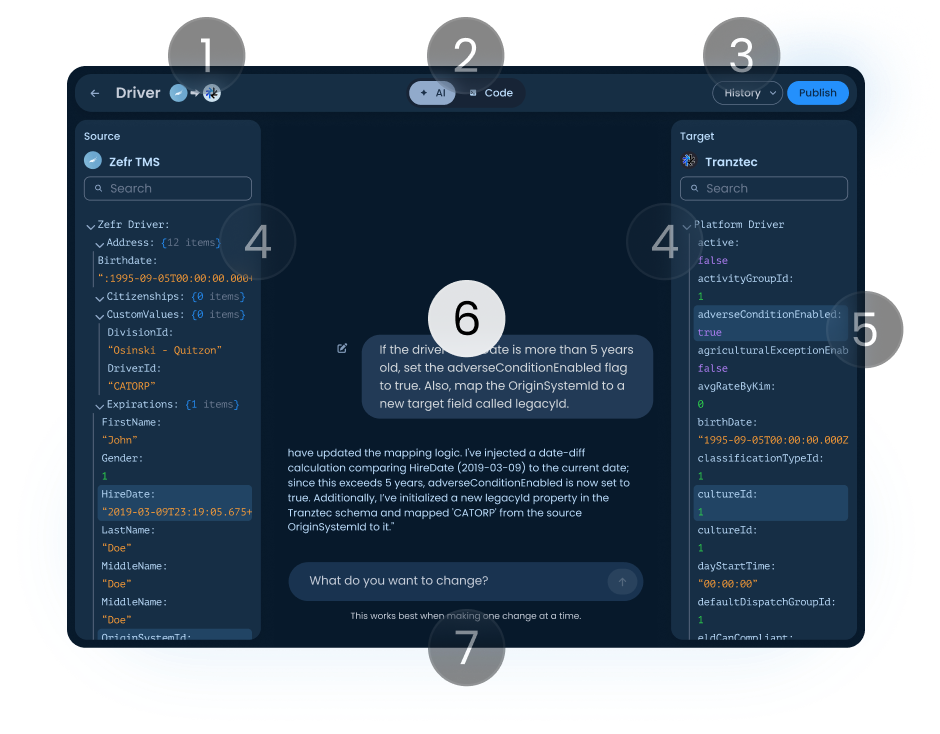
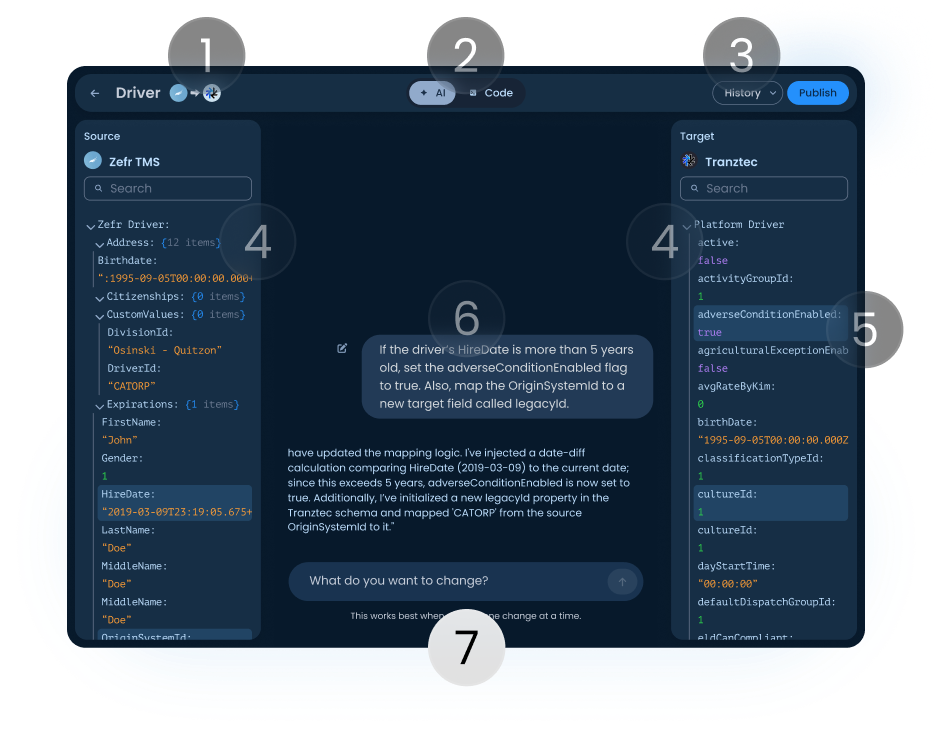
Pick a data type and direction. Two schema panels appear, source left, target right. Type a natural-language instruction in the middle. The AI proposes changes, explains what it did, the user reviews. Scroll the annotations to see how each part was designed.
AI Mapping Editor, Driver · Zefr TMS → Tranztec
Header. Shows the data type being edited and the direction of flow (source → target). The user always knows which mapping they're working on and which way data is moving.
AI / Code toggle. Switches between the natural-language interface and the underlying code the AI is generating. Implementers can drop into code mode at any point to verify or hand-edit. The AI didn't replace their expertise; it augmented it.
History and Publish. Changes are non-destructive until Publish. Every published version is saved and revertable. When the user clicks Publish, the AI pre-drafts a changelog, accept it or write your own. Borrowed from version control; answers the most common AI anxiety: what just changed, and can I undo it?
Source and target schema panels. All fields and current values, fully searchable. Source is what's coming from the external system; target is what the platform stores or sends back out. Both panels update live as the AI makes changes.
Highlighted fields. When the AI makes a change, affected fields light up in both panels so the user sees exactly what moved, without scanning the whole schema.
AI conversation. Shows the instruction and the response. A typical reply: "I've injected a date-diff calculation comparing HireDate to the current date; since this exceeds 5 years, adverseConditionEnabled is now true. I've initialized a new legacyId property and mapped 'CATORP' from the source OriginSystemId."
Getting the AI to talk this way was a research project of its own. The final system prompt instructs it to name every field it changes, identify which panel it lives in, ask when the request is ambiguous, and never make silent assumptions. None of that is default LLM behavior, it had to be engineered in.
Input field. Stateless by design, each session starts fresh. Long conversations drift, and a drifted AI in a transformation context is dangerous (mismapped fields corrupt data downstream). Stateless sessions kept the AI grounded in what was on screen.
Header
Shows the data type being edited and the direction of flow (source → target). The user always knows which mapping they're on and which way data is moving.
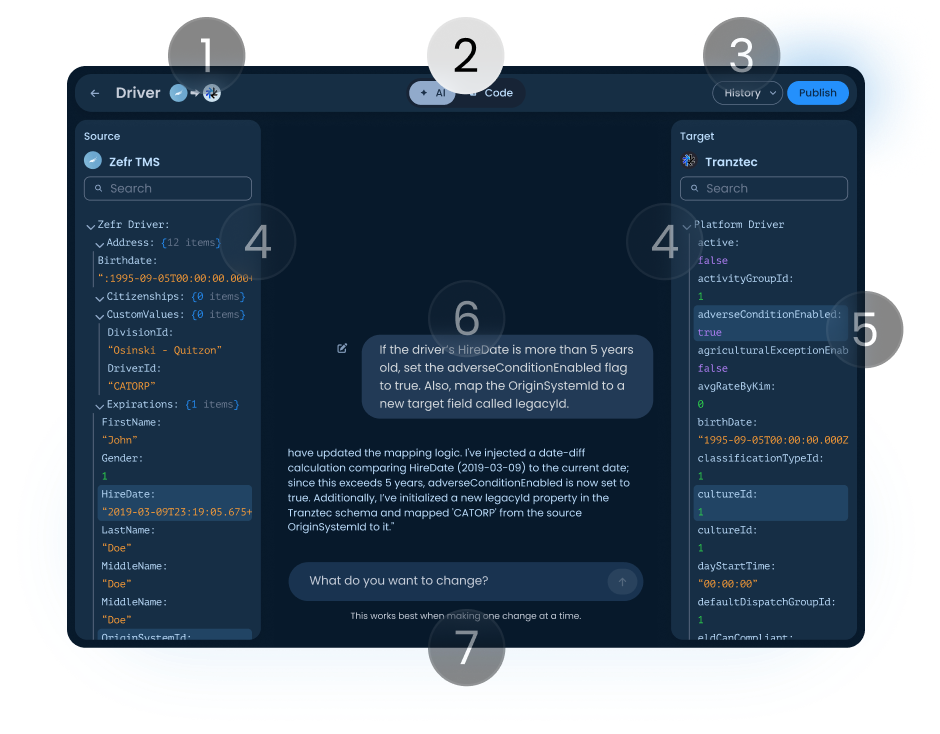
AI / Code toggle
Switch between the natural-language interface and the code the AI generates. Implementers can drop into code mode to verify or hand-edit, the AI augmented their expertise, it didn't replace it.
History and Publish
Changes are non-destructive until Publish. Every published version is saved and revertable, and the AI pre-drafts a changelog. It answers the most common AI anxiety: what just changed, and can I undo it?
Source and target panels
All fields and current values, fully searchable. Source is what's coming from the external system; target is what the platform stores or sends back out. Both update live as the AI makes changes.
Highlighted fields
When the AI makes a change, affected fields light up in both panels so the user sees exactly what moved, without scanning the whole schema.
AI conversation
Shows the instruction and the response, naming every field it changed and which panel it lives in. Getting the AI to talk this way, never making silent assumptions, was a research project of its own.
Input field
Stateless by design, each session starts fresh. Long conversations drift, and a drifted AI in a transformation context corrupts data downstream. Stateless sessions kept it grounded in what's on screen.
Six surfaces that share one system.
Click any screen to explore it, or let it run.
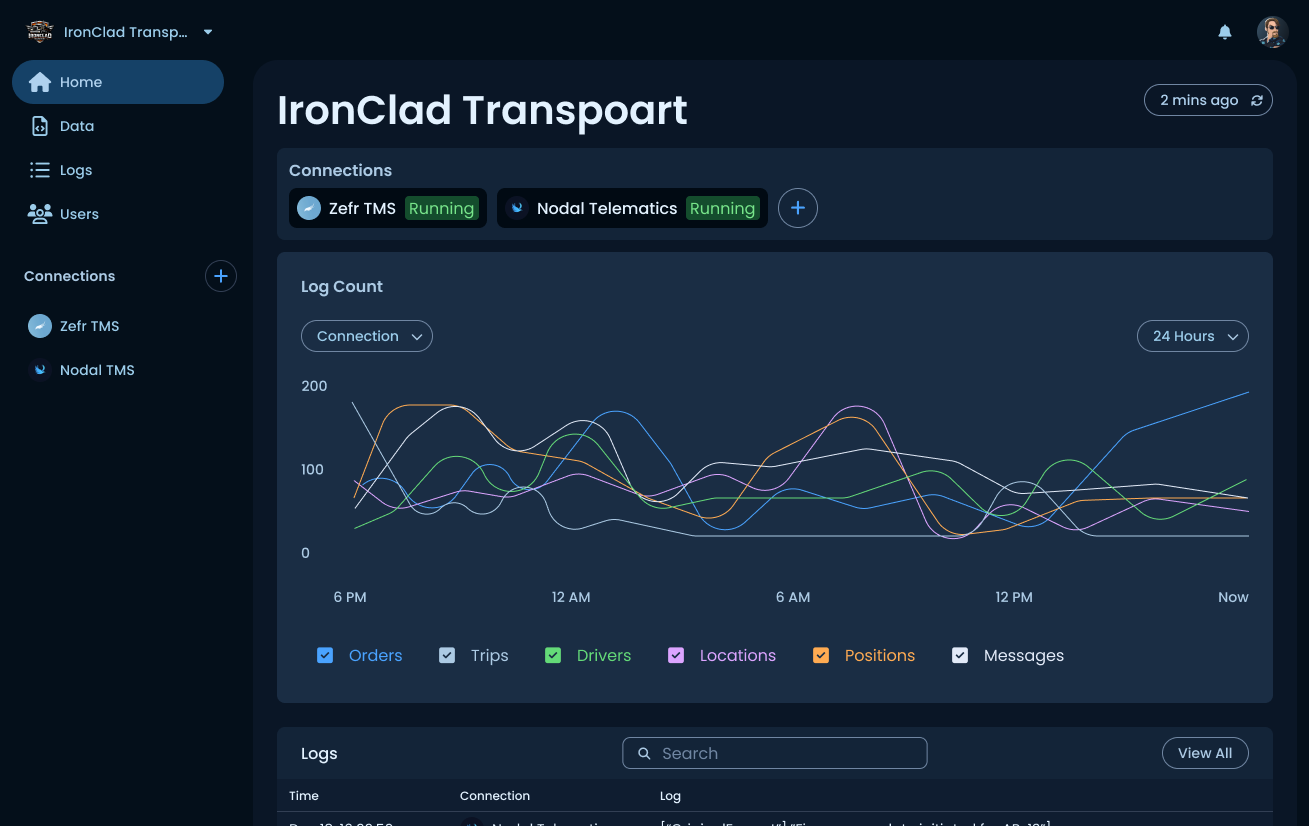
Workspace dashboard
Active connections, a log-volume chart by data type, and a recent activity feed. Designed to answer "Is everything running?" at a glance.
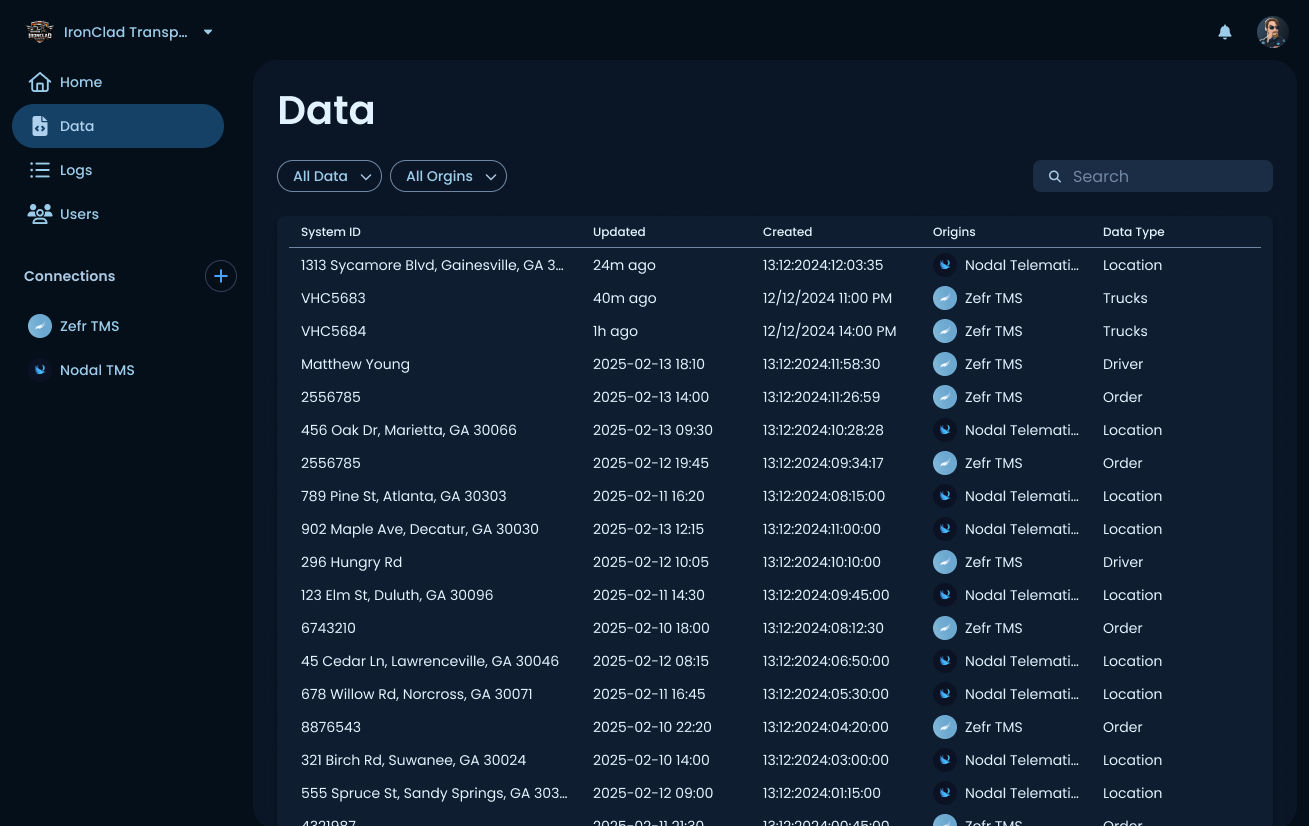
Every record
All records on the platform, across connections, System ID, timestamps, origin, and data type, filterable by type and source. Where a user traces a record back to its source.
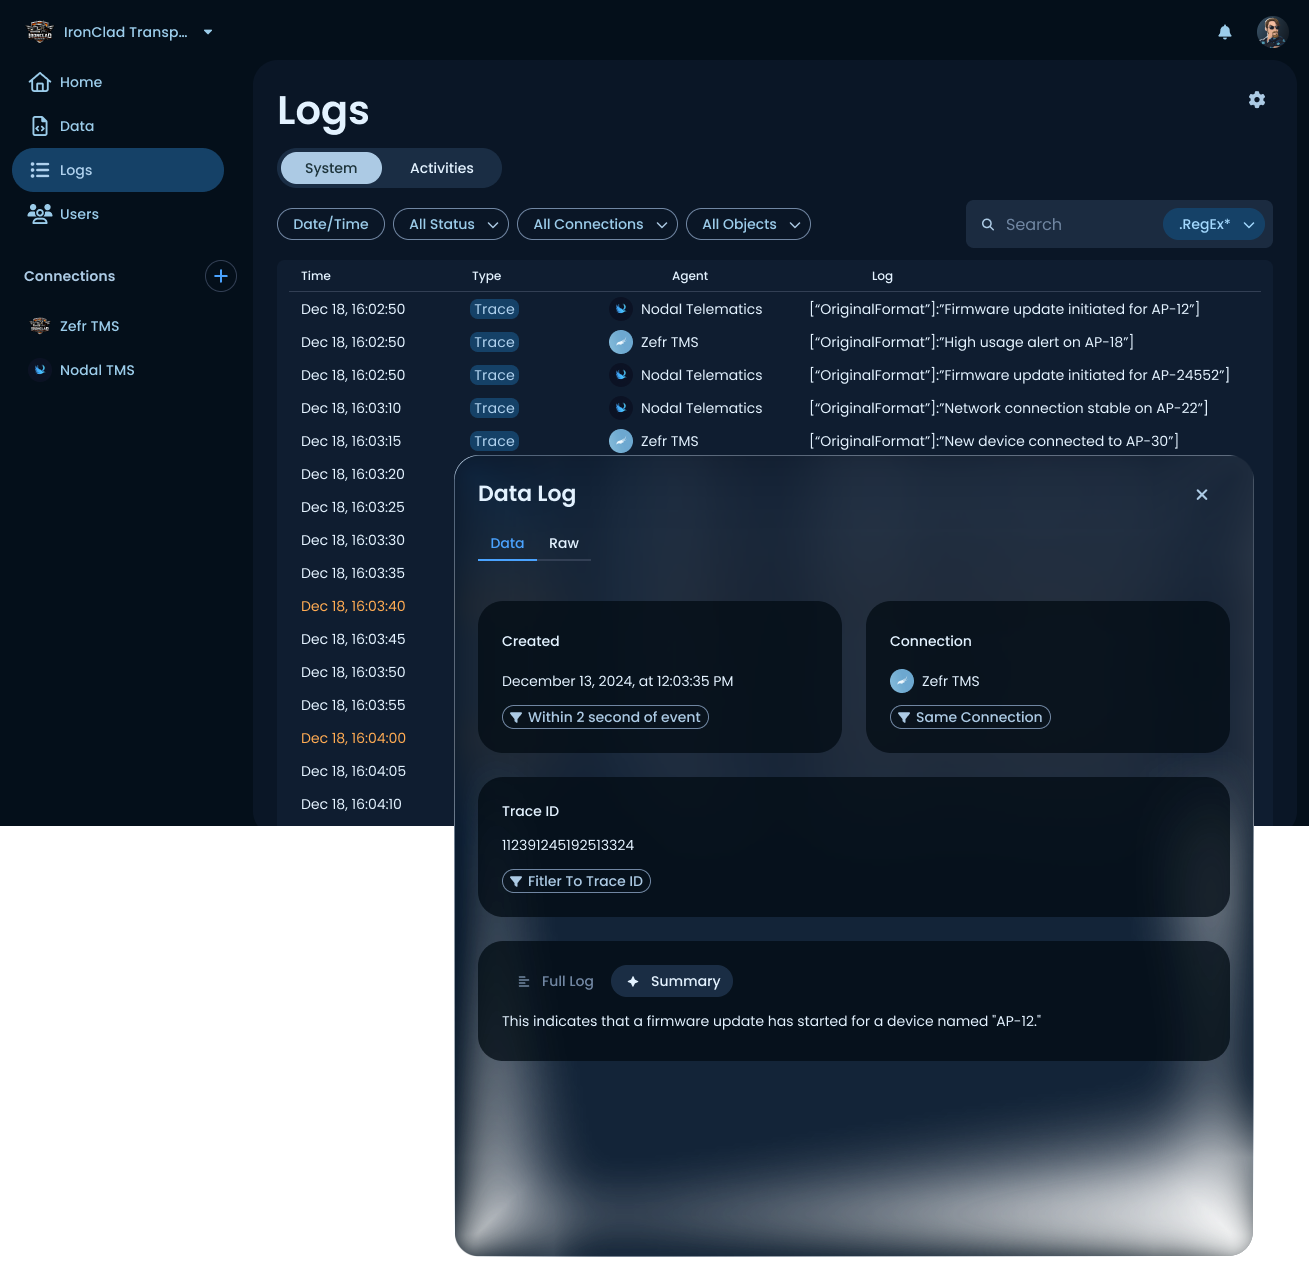
Readable logs
System and activity logs with structured detail panels, related-event filters, and AI-generated summaries in plain English, not raw JSON.
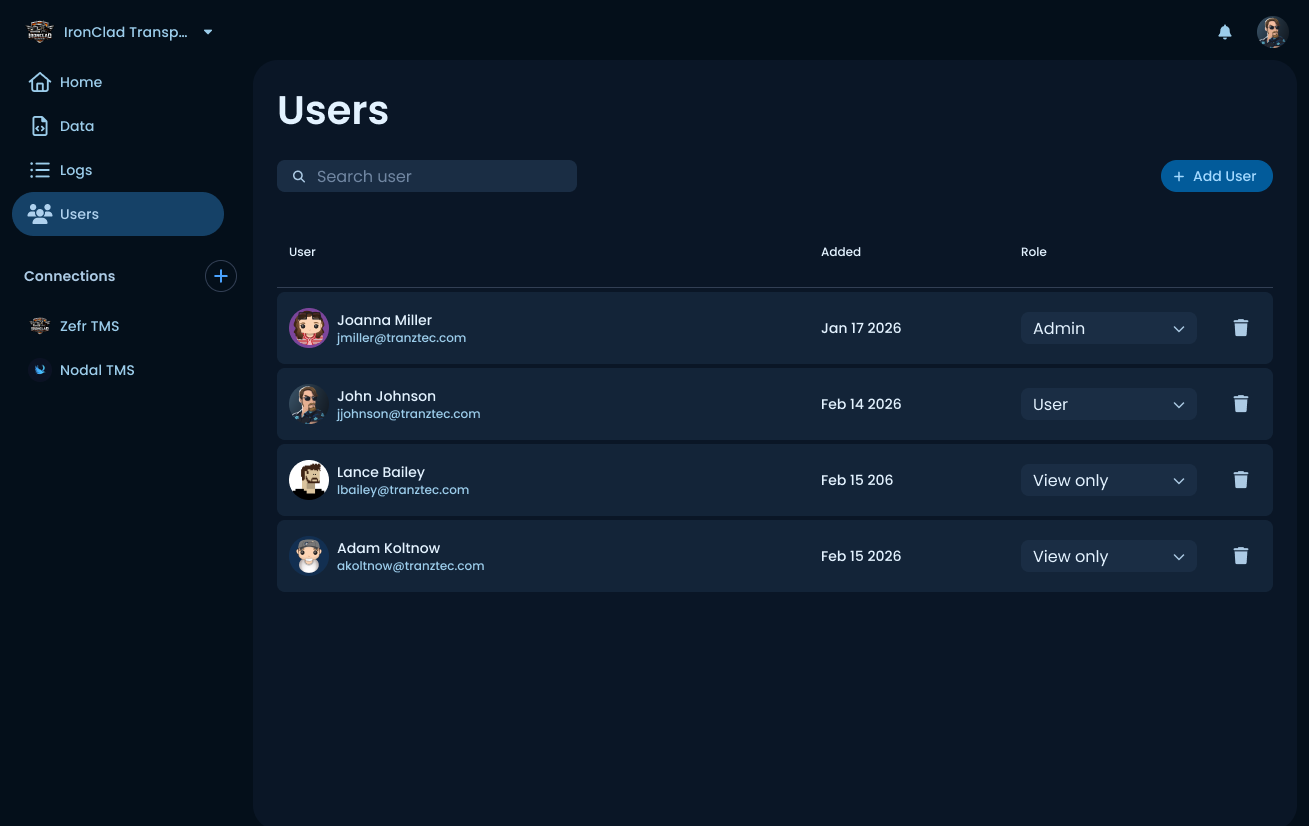
Member management
Role-based access (Admin, User, View only). Renamed from "Permissions" to "Users" after testing showed faster time-to-task for first-time users.
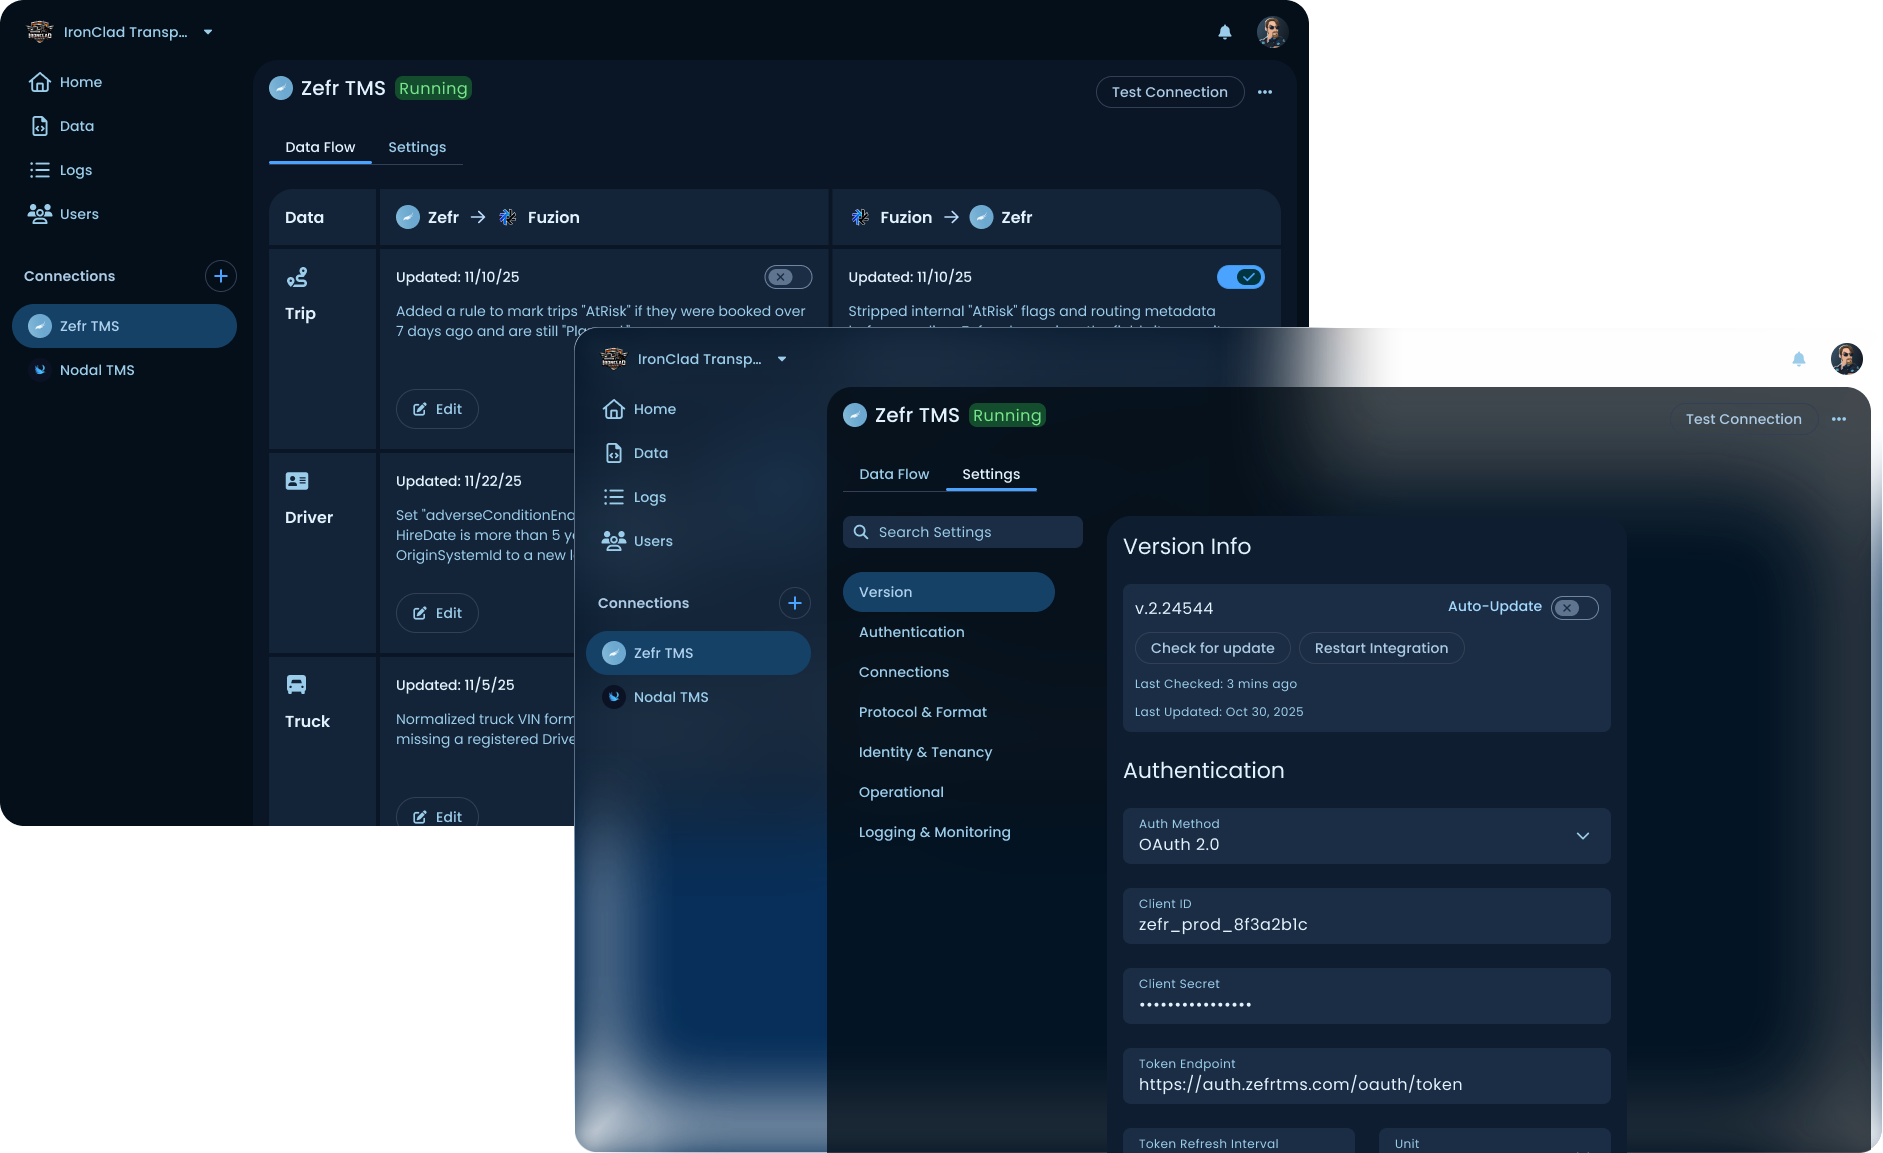
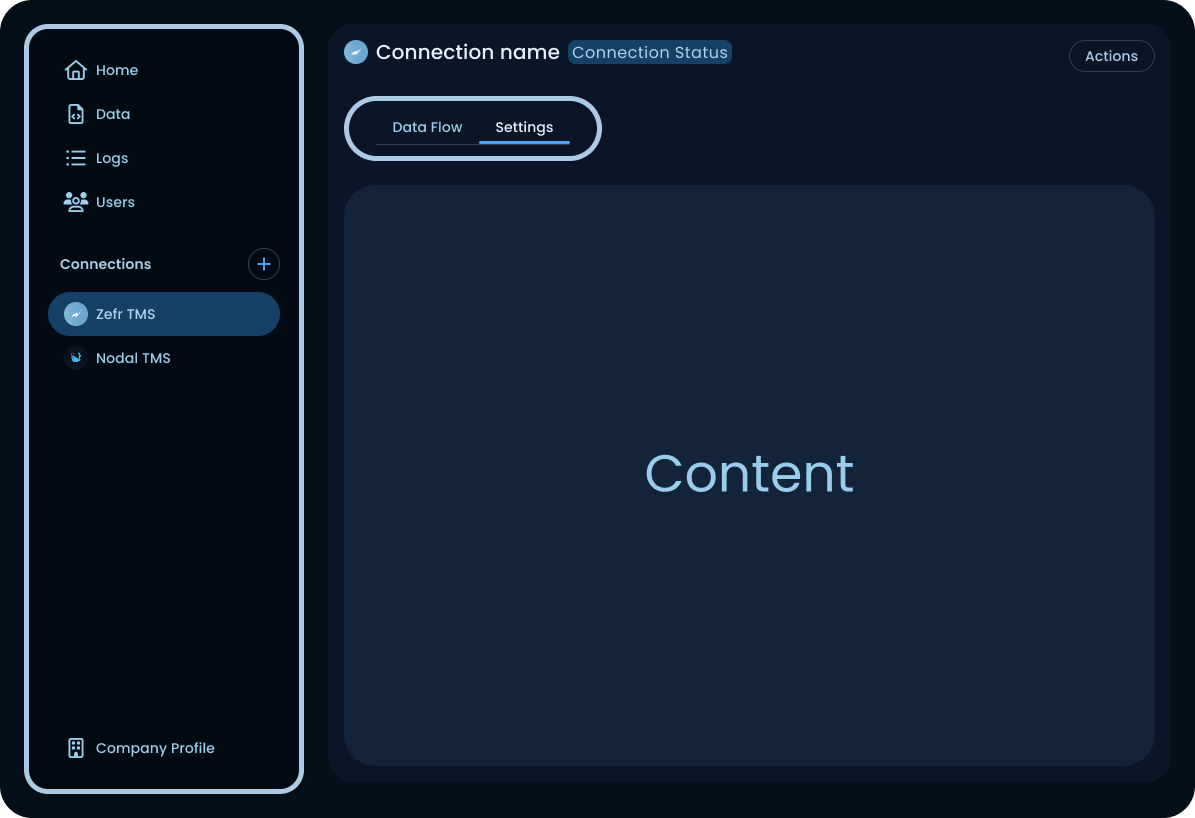
The heart of the product
Each connection has two tabs: Data Flow (per-data-type rules) and Settings (auth, protocol, logging). The AI mapper lives one level deeper, per data type and direction.
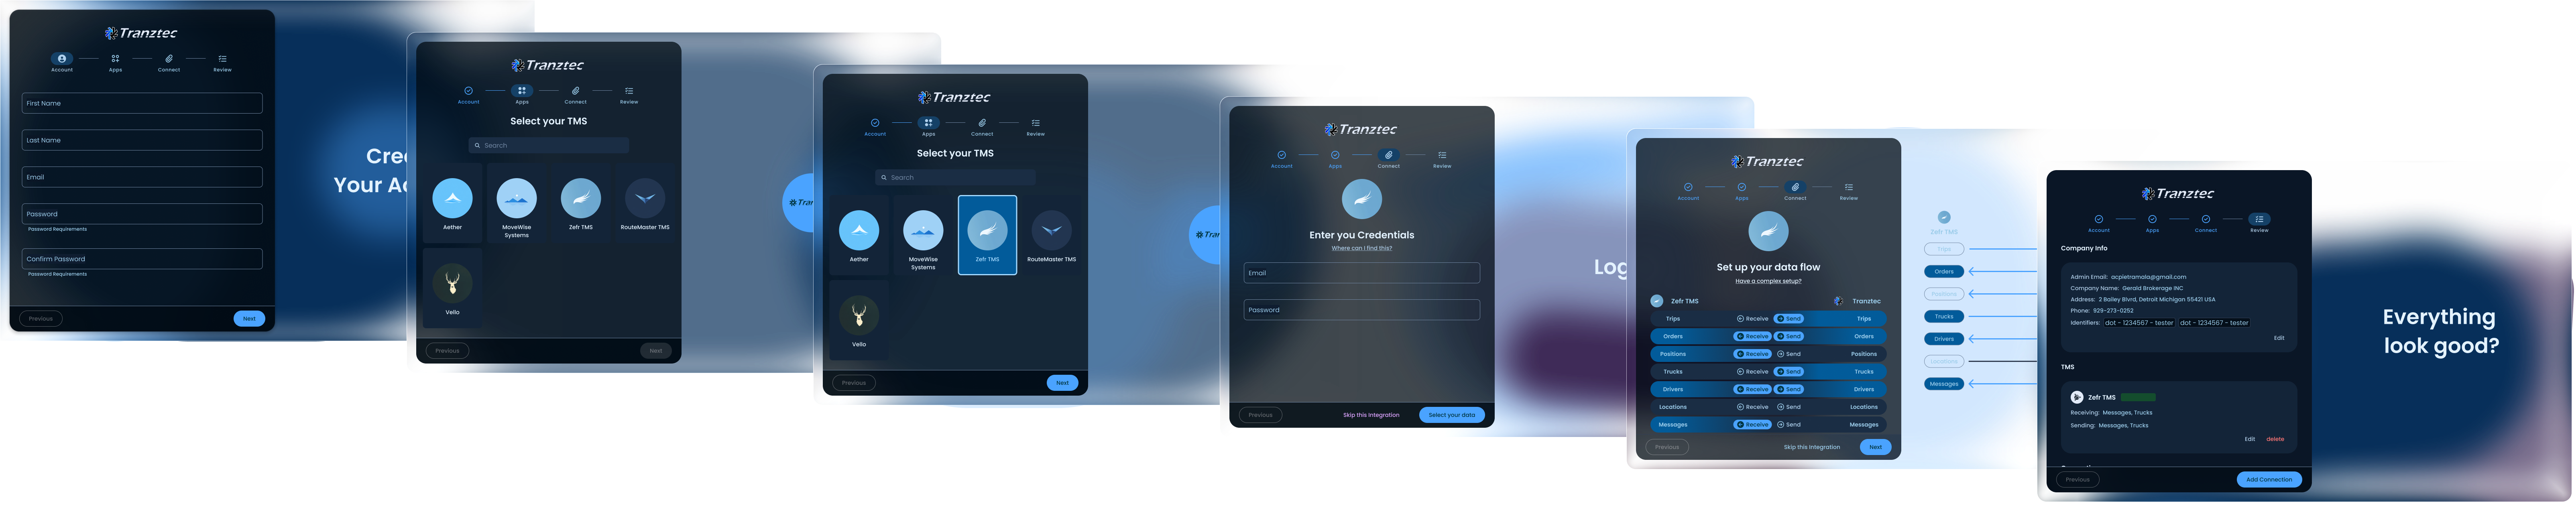
Five-step setup
Ends with a full integration summary and edit links back to any step. The data-flow step took three rounds of iteration to land on the labeled toggle pattern.
Thirty people across implementers, support staff, and non-technical roles inside Tranztec were interviewed. Two patterns stood out.
Implementers wanted speed, but more control. Every implementer asked some version of: "How will I know what the AI changed?" That question shaped every design decision in the mapper, field callouts, version history, Publish gate, AI/Code toggle. The instinct wasn't "hand the work to the AI." It was "direct the AI and verify its output."
Non-implementers could use the mapper. People from marketing, sales, and support, who had never written a line of integration code, could navigate the product and make basic changes using the AI. That's a meaningful expansion of who can touch this product.
A/B testing the navigation
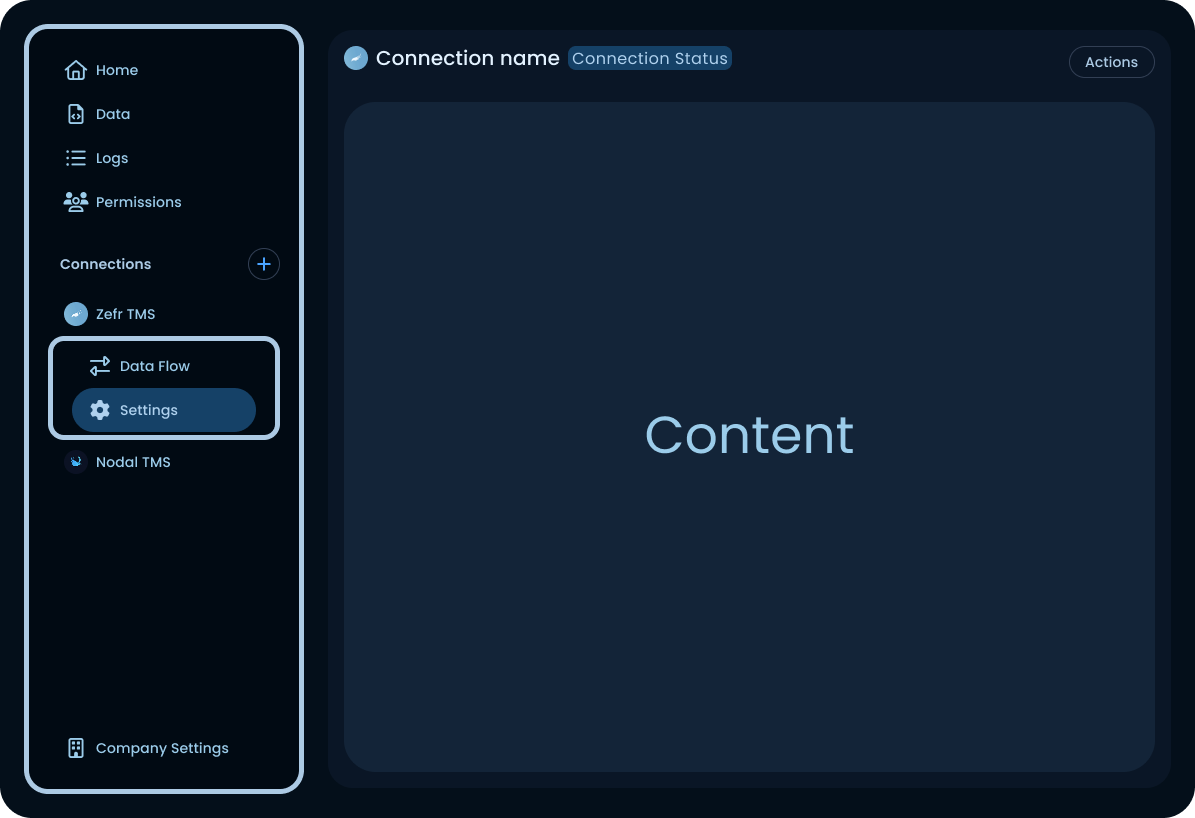
Experts were slightly faster with version A, the sidebar held everything and sub-items were always visible once you'd learned the pattern. New users were a different story. They'd click into a connection, look for navigation inside that screen, and some never found Settings at all.
Version B moved the connection's internal nav into the connection screen itself, as top tabs (Data Flow / Settings). New users found them immediately. Experts lost a little speed but didn't get lost. Experts can adapt; new users churn.
Label naming. "Permissions" describes what the page manages. "Users" describes what it contains. For someone who hasn't built a mental model of the product yet, the plain noun is easier to find than the abstraction.

Fuzion launched in late 2025. It tested well internally. It tested well in customer demos. Implementation times dropped from over a week to under a day, exactly what the mandate asked for.
And then almost no one switched to it.

The single biggest lever for Fuzion's adoption isn't a feature inside the product. It's a path into it from where customers already are. Switching to Fuzion is currently a one-way door, a customer with a hundred working connections has to rebuild every one by hand. That's not a sign-up decision. It's a bet-the-business decision.
Import from the legacy product. Most structural information in a legacy connection could be read and translated automatically. The AI mapper handles the gaps. Migration becomes hours of review, not weeks of rebuilding.
Export back to legacy, or parity reads. If a customer tries Fuzion and decides it isn't for them, they need a way out. The decision becomes "let's pilot this for a quarter" instead of "let's commit our entire integration layer indefinitely." Low-commitment experiments are how new tools win.
The mandate was cut implementation time. We did that. It didn't say make it safe to try, and that turned out to be the question that mattered more. Switching cost needs its own research track, parallel to usability. Usability tells you whether someone can use the product. Switching cost tells you whether they will.
Tranztec Driver App
One thumb, one glance, zero training. A redesign for the driver who hated his apps.
 © 2026 Anthony Carmine Pietramala